Took a hit on the SSO (SP 500 2x ETF) but made it back plus some on QLD (Nasdaq 100 2x ETF)
All in all about 4% - looking back I started buying way too early July, then Sept and the last 1/3 in Dec. - When the real low hit in March I didn't even want to look anymore - so I didn't. Since then the markets made a nice comeback, but I think this run is over for a while.
I'm not going short, till I see some solid sell signals - but I didn't want to risk what it's taken 7 months to get back to.
This is an advanced chart using yearly and monthly Gann cycles which are beyond my scope of explanation:

It's not 100% - nothing is, but he thinks the top is in or very close to it and I agree.
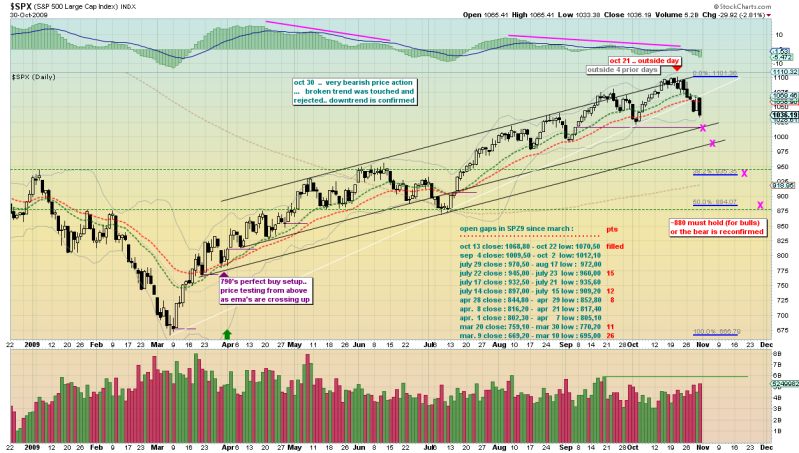
This is a little simpler chart to understand - the SP broke it's blue trendline (Which started off the March lows) in late Sept. and has crawled it's way back on declining volume over the last 7 trading sessions:

Based on a measured move - I'd say a pullback to around 900-950 range and then flattening out would be the healthy - but it's hard to tell since earnings season has just started and we don't know the results or how the street will interpret those results.
If I'm wrong it will mean blowing through that 1078 topline with some volume and that would be a signal to buy back in