poptart wrote:Thanks for the map, Terry.
Still shows Ohio leaning B.O.'s way.
Huh?
Let me explain to you how the map is read.
Blue=Obama
Red=McCain
Dark blue/red states are states that a candidate leads by >/= 10%.
Light blue/pink states are states that a candidate leads by 5-9%.
States with light blue/pink borders are states that a candidate leads by </= 4%, i.e., within the statistical margin of error of most polls.
One state (Virginia) is exactly tied at the moment, so Virginia has no color on the map.
Ohio has a pink border, therefore, Ohio is leaning McCain's way.
That having been said, your concentration on Ohio seems to be a case of missing the forest for the trees, as I will explain below.
Still full of total shit.
You have a different map relying on different state-by-state polls?
I'm not saying this is the way the election will go. I posted the map for a few reasons.
First, the map shows that the electoral support Obama has is more solid than the electoral support McCain has, at the moment anyway. Among states where the lead is >/= 5%, Obama leads the electoral vote by 250-176. That puts him only 20 electoral votes away from an electoral majority.
For the moment, there are 11 states within 4%. Those states (with electoral votes in parentheses) are:
Florida (27)
Ohio (20)
North Carolina (15)
Virginia (13)
Minnesota (10)
Colorado (9)
Nevada (5)
New Hampshire (4)
Montana (3)
North Dakota (3)
South Dakota (3)
The upshot of that is that if Obama wins either Florida or Ohio, it's over. McCain has to win both to even have a shot. And Obama could lose both and still have a shot at winning the general election (although the odds get a little longer in that case).
Strictly at random, there are 2,048 possible scenarios for those states, assuming that Obama or McCain will win all of them. If my math is correct, there are 1,964 scenarios in which Obama wins an Electoral College majority, 74 scenarios in which McCain wins an Electoral College majority, and 10 scenarios which result in an Electoral College tie, thereby throwing the election into the House of Representatives (which would likely work to Obama's advantage this year). Granted, this model is purely random on a state-by-state basis, and therefore doesn't consider the probability of each candidate winning a particular state. But even after that's factored in, given the overwhelming advantage Obama has on the random model, I'd have to believe that the likelihood of him winning the general election, at least at this point, is > 50%.
You'll also note that most of the states up for grabs this year have been reliably Republican states in most years. Of the list above, only four -- Ohio, Minnesota, Nevada and New Hampshire (combined 39 of 112 electoral votes within that group) -- have gone Democratic in a Presidential election more than once since 1964. This year, McCain will be forced, at a minimum, to defend states that Republicans traditionally have not put much effort into keeping in the Republican column. Yes, some of those are small states, but with McCain likely to have little or no margin for error, those states could prove to be more important than you think.
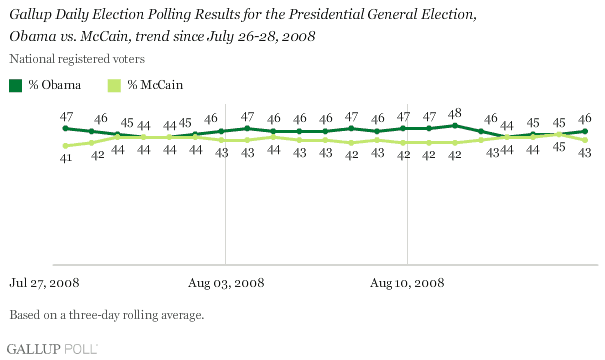
The second reason I posted the map is to refute what most of this board seems to be saying. It seems that a majority, or at least a very vocal minority, of this board "think" (if that's the right word for it) that McCain's election is a foregone conclusion. This current map is the most favorable to McCain since both nominees were known, and represents something pretty close to McCain's best-case scenario. And even then, McCain's election under this map is no sure thing.
Offer of a sig bet on the general election still stands, btw.


